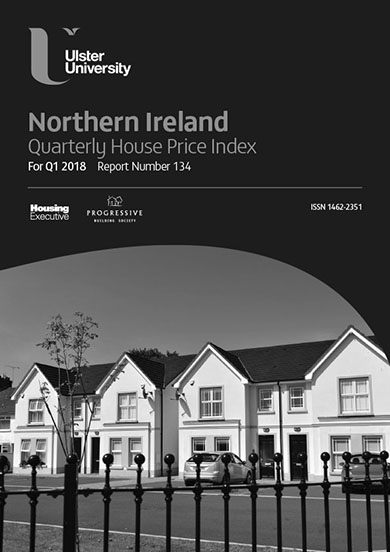
The Northern Ireland housing market has continued to experience a steady rate of price growth in Q1 2018 despite a slight decrease in sales volume, according to Ulster University’s latest Quarterly House Price Index report.
Ulster University’s research is produced in partnership with the Northern Ireland Housing Executive and Progressive Building Society.
In Mid and South Down, the overall average price (£164,955) is somewhat lower compared to the first quarter of 2017, down by 4.8%, but largely unchanged over the quarter (up by 0.1%). However, in terms of performance by property type, average price levels are largely higher with semi-detached houses (£129,166) up by 11.6% over the year and by 0.3% over the quarter.
 Likewise, detached houses (£271,172) are up by 8.3% over the year and by 12.4% quarterly. Apartments (£132,557) are slightly higher over both the annual (3%) and quarterly (0.8%) timescales. In contrast, the average sale price of terrace/townhouses (£90,935), although higher over the year by 2.4%, is down over the quarter.
Analysing the performance of the Northern Ireland housing market during January, February and March 2018, the overall average price for the first quarter of 2018 was £163,621, representing an annual increase of 6.6% relative to the first quarter of 2017.
However, allowing for differences in sample mix by property type, the weighted increase over the year is 4%, indicating real growth in sale price above the rate of inflation.
The average house price for Northern Ireland is also higher over the quarter with a 3.4% simple percentage increase relative to the final quarter of 2017 or in weighted terms, allowing for changes in sample mix, a rise of 3.1%.
 The distribution of sale prices is broadly similar to the previous quarter although the share of lower priced properties at or below £100,000 has decreased to 22% of the sample.
Likewise, the market share by property type remains broadly consistent with previous reports. Semi-detached houses continue to be the dominant sector, accounting for more than one third of all transactions (35%, n=638).
Sales volumes are lower for the first quarter of 2018, almost certainly reflecting seasonality in the market and the relatively adverse weather conditions that prevailed in the opening months of 2018. The volume of transactions in the survey is 1,842 compared with 2,219 in Q4 2017.
Lead researcher, Professor Stanley McGreal from Ulster University said: “The latest survey of the housing market in Northern Ireland indicates a steady rate of price increase of 4% annually and 3.1% over the last quarter. These rates of growth, above the general level of inflation, can provide confidence to both home-owners and potential purchasers regarding the value of their investments while still maintaining affordability in the local housing market.”
Michael Boyd, Progressive Deputy Chief Executive and Finance Director added: “The seasonal impact on sales within the housing market in Q4 2017 has been offset by a strong start to 2018. Prices across most house types and regions are up in Q1 2018, representing steady but sustainable growth as the report measures an increase in sale price above the rate of inflation.
“The consumer squeeze that had been building throughout 2017 has eased, with inflation falling against the backdrop of rising wages, which has boosted spending power for local households.”
Karly Greene, Head of Research at the Northern Ireland Housing Executive, said: “The survey shows that the gradual upward drift in the average price of dwellings sold in Northern Ireland continued during the first quarter of 2018.
“Overall, the housing market remains in a buoyant state, with the volume of transactions in line with seasonal trends and a sense of optimism among estate agents about the short term outlook.
“However, with concerns about supply of good quality stock at lower price points, it is important that we continue to monitor housing supply and affordability in the region, especially for first time buyers.”
The full report can be found at: goo.gl/JujR1.
Market share by type of property
| Market sector | Market Share |
| Terrace/townhouse | 20% |
| Semi-detached house | 35% |
| Detached house | 24% |
| Semi-detached bungalow | 3% |
| Detached bungalow | 8% |
| Apartment | 10% |
| Market sector | Annual % Change | Quarterly % Change | Average Price Q1 2018 |
| Terrace/townhouse | 2.8% | 2.5% | £103,518 |
| Semi-detached house | 3.6% | 0.2% | £148,894 |
| Detached house | 3.7% | 4.8% | £248,680 |
| Semi-detached bungalow | -0.5% | -4.7% | £111,578 |
| Detached bungalow | -0.8% | -0.1% | £176,864 |
| Apartment | 15.8% | 13.2% | £136,465 |
Performance by Region
| Location | Average Price
2018 Q1 |
| Northern Ireland – All | £163,621 |
| Belfast-All | £175,908 |
| North Belfast | £127,889 |
| South Belfast | £225,101 |
| East Belfast | £182,540 |
| West Belfast | £130,098 |
| North Down | £186,416 |
| Lisburn | £181,694 |
| East Antrim | £151,906 |
| L’Derry/Strabane | £118,970 |
| Antrim Ballymena | £137,456 |
| Coleraine/Limavady/North Coast | £156,365 |
| Enniskillen/Fermanagh/S.Tyrone | £132,290 |
| Mid Ulster | £145,231 |
| Mid and South Down | £164,955 |
| Craigavon/Armagh | £136,567 |


